Liver Iron Content (LIC) from R2 on a 1.5T MRI scanner - calculator
Two formulas are calculated from R2* (star) value.
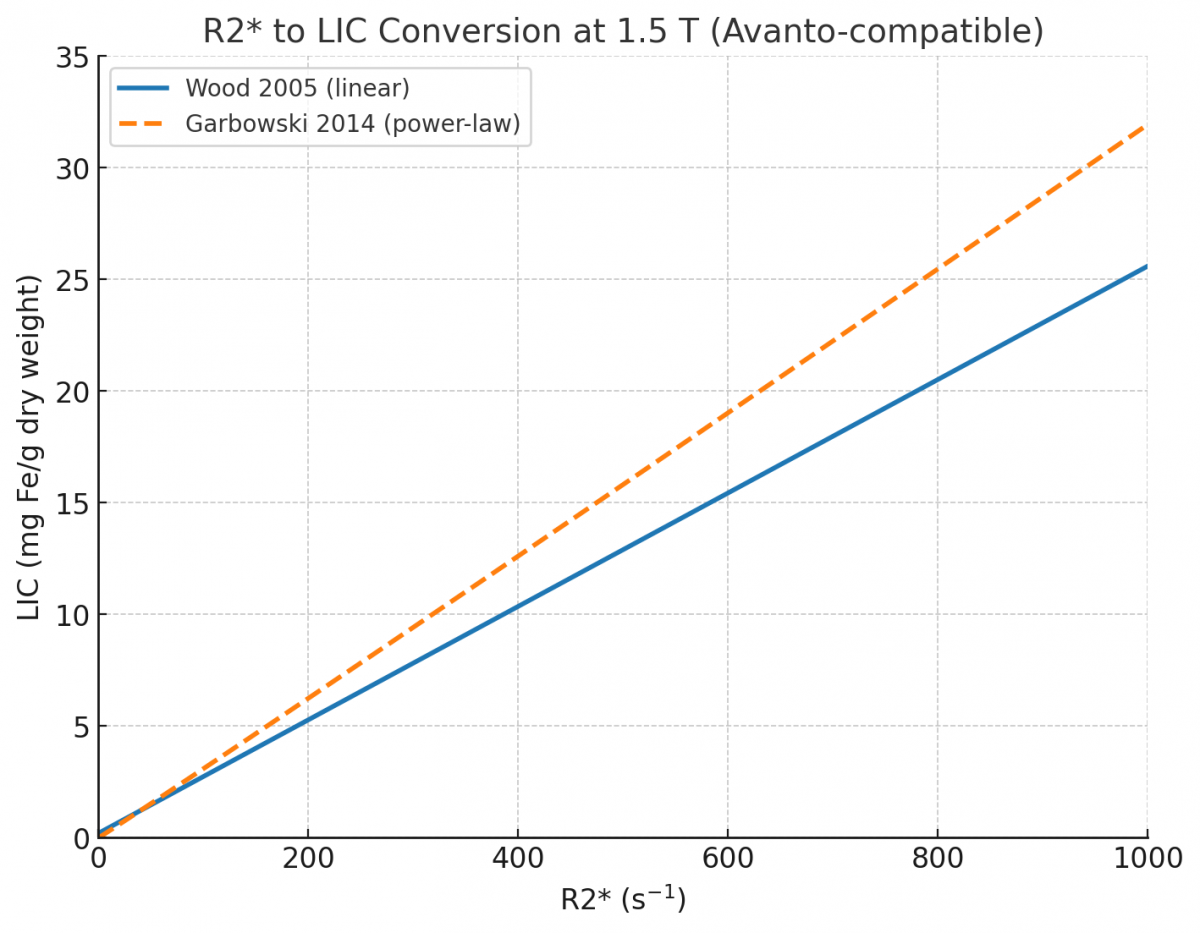
Wood et al.: LIC = 0.0254xR2+0,202
Garbowski: LIC = 0.0290xR2^1.014
| Parameter | Value | |
|---|---|---|
| R2* | [s-1] | |
* Required
Volume:
Interpretation
- 0 - 2: normal
- 2 - 7: mild overload
- 7 - 15: moderate overload
- >15: severe overload
If you want maximum comparability with published literature, vendor default software, and historical follow-up data → Use Wood (linear). This is what most Avanto-based clinical LIC reports still use, especially for routine patient management and in older longitudinal data sets.
If your priority is highest biopsy agreement across the full iron range, especially >15 mg/g dw, and you’re doing research or high-accuracy quantification → Use Garbowski. It’s slightly nonlinear and will give higher LIC than Wood in heavy overload cases.
References:
Wood JC, Enriquez C, Ghugre N, Tyzka JM, Carson S, Nelson MD, Coates TD. MRI R2 and R2* mapping accurately estimates hepatic iron concentration in transfusion-dependent thalassemia and sickle cell disease patients. Blood. 2005 Aug 15;106(4):1460-5.
Garbowski MW, Carpenter JP, Smith G, Roughton M, Alam MH, He T, Pennell DJ, Porter JB. Biopsy-based calibration of T2* magnetic resonance for estimation of liver iron concentration and comparison with R2 Ferriscan. Journal of cardiovascular magnetic resonance. 2014 Dec 5;16(1):40.